
Check this out about the first actual computer bug ever recorded:
http://www.computerhistory.org/tdih/September/9/
bgbg
Check this out about the first actual computer bug ever recorded:
http://www.computerhistory.org/tdih/September/9/
bgbg
What exactly should a computer program do? How will you know if the program you have written or requested to be written for you does what you need it to do?
It’s really a whole lot simpler than you might think.
If you, as a business user, can define what information is available to accomplish the automated task at hand (the purpose of the program). And, you can define, in detail, the processes that are to be done using this available information (the calculations, manipulations, sorting, totaling, etc.). And define the output results that this program should be expected to provide to you as the user, then you have defined the entirety of your requested program.
A program should only ever take INPUT, PROCESS it according to a business user’s specifications, and create OUTPUT requested by that user. If a program tries to do anything else other than Process Input to create defined Output, then it is doing more than and probably unexpected things that no one asked the programmer to create. This would be a BAD outcome.
The Software Engineering science of defining these specifications in these terms has been referred to as a IPO Diagram with three columns. Can you guess what these columns might be?
IPO Table Sample v1 bg 20110812
IPO Table Sample v1 bg 20110812
If you try this at an appropriate level of detail, you should be able to get a clear understanding of how this can work for you in your business need; HOWEVER, remember that the amount of details you put into this effort will be reflected in the completeness and accuracy of the results.
Syntax Rules for an Entity Relationship Diagram:
An Entity Relationship Diagram Sample:
Use this link: https://docs.google.com/drawings/d/1keA4BzVCJXcUoNWDw7-0pIrQ7AsB5CgavjWR7P5Wyrg/edit?hl=en_US (may have to paste into a browser)
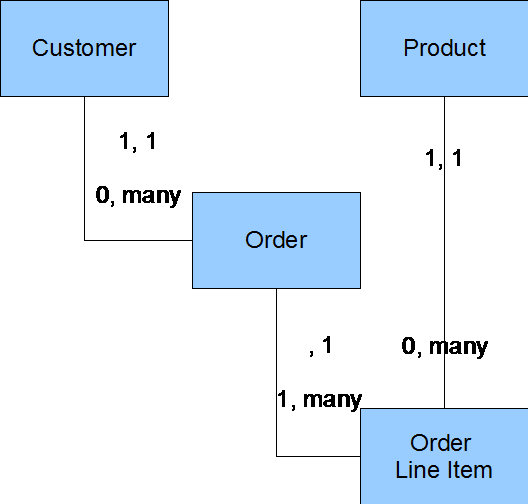
Business Rules derived from this sample are:
It is also interesting to note that since there is no relationship between Customer and Product there are no Business Rules that can be derived between these two collections of data (entities), YET.
Flowcharts, Data Flow Diagrams, Swim Lane diagrams, Use Cases and other constructs have been used to reflect what a Business or Systems Analyst thinks the client is describing when they talk about Business Process and the use of information in the conduct of their business.
These diagrams have structure, syntax, and rules that have been described through the work of authors, vendors, and users throughout their popular years and are still being applied today; however my concern is that these techniques and their principles are being lost in the more pervasive information about AGILE, Iterative, and other quick fixes to some pretty old problems.
Other related types of drawings or ordered lists that I have seen used are: NASSI-SCHNEIDERMANN Diagrams, Functional Decomposition outlines, Warnier-Orr diagramming, Jackson Data Diagrams. Although these had value in their day, they were not as pervasive as some of the others process and program design diagrams that were mentioned in the first paragraph here.
So, What’s the POINT? I think that software needs to be an engineered product and these techniques and structured diagramming tools are, to me, a lot like Blue Prints for construction of buildings with electrical, plumbing, HVAC, Safety and Security viewpoints, each of which have similarities in the construction of Software. And yet, the more recent Software design techniques are focused on RAPID, Iterative, AGILE development that implies to me that current solution development efforts want to skip over those planning, analysis, and design activities while they still expect usable results.
For one, I don’t think this is a healthy evolution for our automated business solutions future.
If you are interested in seeing sample diagrams or starting a thread of conversation about these topics, please send me an email at whendoyoustoplooking@gmail.com – thanx, bgbg
One of the basic principles of Software Engineering is the creation of visual models to demonstrate the project team’s understanding of the discoveries we are collecting from the users who are driving our discussions.
The type of drawings were proscribed by several authors of the time but regardless of the style of the drawing, they all have a relatively consistent set of focal points:
Information Technology (IT) has been moving towards a “Popcorn Culture” for many years where our Practitioners are regularly looking for a quick POP of a little progress in technology. When I was growing up in the world of computer programming, we were taught that this work took planning, design, testing, and re-work before a product was “ready for prime time” and then be useful as a Production Program that is reliable, sustainable, and accurate.
I don’t expect that everyone in IT will read my stuff here and turn their lives around to re-acquaint themselves with the principles and techniques of Software Engineering (as I knew it) for designing business solutions; however, I am interested in recording what I believe are fundamentally sound practices for determining what to build and that have value to functioning organizations in today’s and tomorrow’s worlds.
Please let me know what you think about these writings and, if you think they are valuable, please subscribe to this feed, and leave me some comments, so you can get my latest opinions as they are published.
Thank you, Bill Gutches
PS: If you are interested in getting more info on this and other related topics, please send me an email to whendoyoustoplooking@gmail.com and I will gladly respond.

